
For the same 40-year-old couple, same $60K USD-equivalent spending target, same 80/20 portfolio, and the same 55-year fat-tailed Monte Carlo model, Retirement Lab produced a wide spread: Malaysia and Thailand cleared the 95% success threshold near $720K, while Switzerland required about $2.89M. That is a $2.17M spread before changing the household, market assumptions, or spending target.
This article compares the 26 tax-residence countries Retirement Lab supported when the ranking was run in August 2026. Retirement Lab has since added Chile, Czechia, Hungary, South Africa, and Vietnam, bringing the supported set to 31; those five are not in this ranking. It is a complete ranking of the country set as it stood, not a worldwide ranking of every possible destination.
| Rank | Country | Portfolio for 95% target | Wealth tax modeled | World Bank price level (US=1.00) |
|---|---|---|---|---|
| 1 | Malaysia | $720K | no | 0.32 |
| 2 | Thailand | $720K | no | 0.31 |
| 3 | Panama | $1.12M | no | 0.51 |
| 4 | Brazil | $1.14M | no | 0.47 |
| 5 | Greece | $1.39M | no | 0.60 |
| 6 | Malta | $1.40M | no | 0.63 |
| 7 | Mexico | $1.44M | no | 0.59 |
| 8 | Cyprus | $1.49M | no | 0.64 |
| 9 | UAE | $1.51M | no | 0.70 |
| 10 | Costa Rica | $1.56M | no | 0.64 |
| 11 | Japan | $1.56M | no | 0.66 |
| 12 | Portugal | $1.56M | no | 0.60 |
| 13 | Singapore | $1.65M | no | 0.78 |
| 14 | Uruguay | $1.72M | no | 0.73 |
| 15 | France | $1.72M | no | 0.78 |
| 16 | Italy | $1.73M | yes | 0.68 |
| 17 | Spain | $1.76M | yes | 0.64 |
| 18 | Germany | $1.88M | no | 0.76 |
| 19 | UK | $1.88M | no | 0.87 |
| 20 | Canada | $1.99M | no | 0.91 |
| 21 | Belgium | $2.00M | no | 0.81 |
| 22 | Austria | $2.03M | no | 0.78 |
| 23 | Australia | $2.13M | no | 0.94 |
| 24 | US | $2.20M | no | 1.00 |
| 25 | Netherlands | $2.57M | yes | 0.80 |
| 26 | Switzerland | $2.89M | yes | 1.26 |
How we ran it
The household was deliberately plain: a couple, both age 40, retiring in 2026 with an 80/20 global equity/bond portfolio, annual rebalancing, and $60,000 of year-0 spending before country cost-of-living adjustment. Retirement Lab then converted the target spending into local-currency spending using the COL and FX tables in the run metadata, applied country tax rules year by year, and ran 10,000 independent-year Monte Carlo paths with the standard left-tail adjustment (simulation_mode=monte_carlo_iid, regime_aware=false, skewness_factor=2.0). Success means the portfolio stayed above zero through age 95, a 55-year retirement.
Why age 95? Average life expectancy is not the same thing as a fixed planning endpoint for a couple. The Society of Actuaries' longevity guidance emphasizes both the chance of living beyond average life expectancy and the last-survivor problem for couples. Age 95 makes the comparison conservative enough that a retirement beginning at 40 does not quietly stop while one spouse may still be alive.
The number in the ranking is the smallest tested USD-equivalent starting portfolio that cleared a 95% simulated success target in its linked 10,000-path production run. In other words, the ranking does not compare countries at different target probabilities: the portfolio is the variable, and 95% is the common target. A local common-path search located each threshold; production cases below 95% were increased and rerun. We did not keep rerunning unchanged inputs to select favorable samples.
These runs were computed in August 2026 under Retirement Lab's 2026-06-23.v1 result semantics. The engine's country coverage and cost-of-living handling have changed since, so a scenario opened today can produce a different threshold than the one published here. The linked scenarios stay useful as editable starting points; treat the exact figures as a dated snapshot rather than a live readout.
Where the cost-of-living numbers come from
The cost multiplier is the World Bank's 2024 Price level index for households and NPISH final consumption (PA.NUS.PRVT.PLI), downloaded after its 2026-07-13 update and licensed CC BY 4.0. The published US value is 100; we divide every country's index by 100, making the US 1.00. No hand-tuned country overrides remain in this ranking.
This is a broad national household-consumption basket, not a retiree-only basket. The International Comparison Program methodology describes food and beverages, clothing and footwear, utilities, furniture and appliances, pharmaceuticals and private healthcare, vehicles and transportation, communications, restaurants and accommodation, recreation, personal care, private education, and other household goods and services. Housing is included: the housing survey uses rents for comparable dwellings where rental markets are representative, or dwelling-stock quantity and quality data where they are not.
That breadth is useful for a 26-country baseline, but it is still a national average. Also note that the price level is a 2024 observation used to scale a 2026 spending target; it is not adjusted forward for country-specific inflation between those years. It does not represent a particular city, an expat neighborhood, a retiree's healthcare mix, or whether the household rents or owns. Those choices should be modeled by replacing the $60,000 spending input rather than treating this ordering as a universal affordability ranking.
The simulation also does not project future exchange-rate paths or country-specific inflation. It uses one year-0 FX conversion and applies the same 1.8% annual inflation assumption in every country. That keeps the country comparison controlled, but it is not a 55-year forecast of what a USD portfolio will buy in each local currency.
This is a scenario comparison, not an objective country affordability index. The cost-of-living inputs scale the same $60,000 US spending target and therefore drive a substantial part of the result. Different housing, healthcare, exchange-rate, tax-residency, or lifestyle assumptions can change both the required portfolio and the ordering.
The top five
The first break in the ranking is the striking one: Malaysia and Thailand tie at $720K. Their World Bank price levels are 0.32 and 0.31. The equality should not be read as false precision—the search moved in $10K steps—but both cases sit in a category of their own.
Panama and Brazil form the next tier, at $1.12M and $1.14M. The $20K gap is only two search steps, so the useful signal is the cluster rather than the exact order. Both need roughly $400K more than the sub-$1M pair.
Greece closes the group at $1.39M. Its 0.60 price level is close to Mexico and Portugal, but its position shows again that this is not simply a sorted cost-of-living table. “Lower-cost country” is not one financial category once taxes and a 55-year horizon enter the simulation.
The bottom five
Austria and Australia open the bottom five, at $2.03M and $2.13M. Their modeled mechanics differ, but neither receives the large spending discount seen in the leading country cases.
The US case, at $2.20M, is the useful baseline. It receives no cost-of-living discount in this comparison. Moving above or below it reflects the combined effect of the country price level and modeled tax treatment, not either input in isolation.
Netherlands and Switzerland still create a bottom-end cliff. The jump from the US to Netherlands is $370K, followed by another $320K to Switzerland. The absolute thresholds are lower under fat-tail IID, but that discontinuity remains the story; the tax mechanics behind it come next.
Tax surprises
The Netherlands is the clearest tax surprise. Its World Bank price level was 0.80—below the UK, Canada, Australia, and the US—yet its required portfolio was second-highest at $2.57M. In this modeled case, Box 3-style deemed-return taxation substantially changed the result relative to what a cost-of-living screen alone would imply.
Spain is another useful warning against reading the table as a pure affordability ranking. Its price-level input was 0.64, close to Cyprus and Malta, but the modeled wealth tax begins to matter as the portfolio grows. Spain landed at $1.76M, compared with $1.49M for Cyprus and $1.40M for Malta.
France needs a more explicit qualification than the other rows because the US–France treaty result depends on the source and type of the household's actual holdings. For the linked France case, we modeled the same married US-citizen couple as full-year French tax residents with no employment or pension income, an 80%-cost-basis taxable US-domiciled portfolio whose investment income and gains qualify for Article 24 relief, and both adults included in the PUMa/CSM calculation. The simulation shows a $1.72M threshold and 93.8% success at $1.5M. In a separate endpoint with no qualifying Article 24 portfolio income or gains, the corresponding results were $1.96M and 87.4%. A household with a mixture of qualifying and non-qualifying investments would fall between those modeled endpoints.
Switzerland combined the highest price level in the set—1.26 of the US baseline—with cantonal wealth taxation, producing the highest required portfolio at $2.89M. The UAE and Panama show the opposite pattern: their modeled personal-tax treatment is light, but their positions still reflect the spending adjustment as well as tax.
These are outputs of the calculator's default country cases, not claims about every household's tax liability. Tax residence, citizenship, account wrappers, source of income, region, and special regimes can change the result.
A dual view: target portfolio versus a fixed $1.5M
The first view asks, “How much portfolio did this country case need to reach the common 95% target?” The second holds the portfolio constant at $1.5M and asks what success probability the same model produced.
$1.5M is a useful fixed reference because $60,000 is exactly 4% of $1.5M. That makes the second view a recognizable 4% starting-withdrawal case while preserving the same couple, age-95 endpoint, 80/20 portfolio, cost-of-living adjustment, and country tax model. These are separate 10,000-path production runs, not probabilities borrowed from the threshold search.
| Threshold rank | Country | Success with $1.5M |
|---|---|---|
| 1 | Malaysia | 99.9% |
| 2 | Thailand | 99.8% |
| 3 | Panama | 98.0% |
| 4 | Brazil | 98.4% |
| 5 | Greece | 96.1% |
| 6 | Malta | 96.4% |
| 7 | Mexico | 97.0% |
| 8 | Cyprus | 95.6% |
| 9 | UAE | 95.3% |
| 10 | Costa Rica | 94.5% |
| 11 | Japan | 93.4% |
| 12 | Portugal | 95.6% |
| 13 | Singapore | 93.0% |
| 14 | Uruguay | 92.4% |
| 15 | France | 93.8% |
| 16 | Italy | 92.4% |
| 17 | Spain | 94.4% |
| 18 | Germany | 90.9% |
| 19 | UK | 90.9% |
| 20 | Canada | 88.7% |
| 21 | Belgium | 89.0% |
| 22 | Austria | 88.8% |
| 23 | Australia | 87.4% |
| 24 | US | 85.9% |
| 25 | Netherlands | 80.6% |
| 26 | Switzerland | 70.5% |
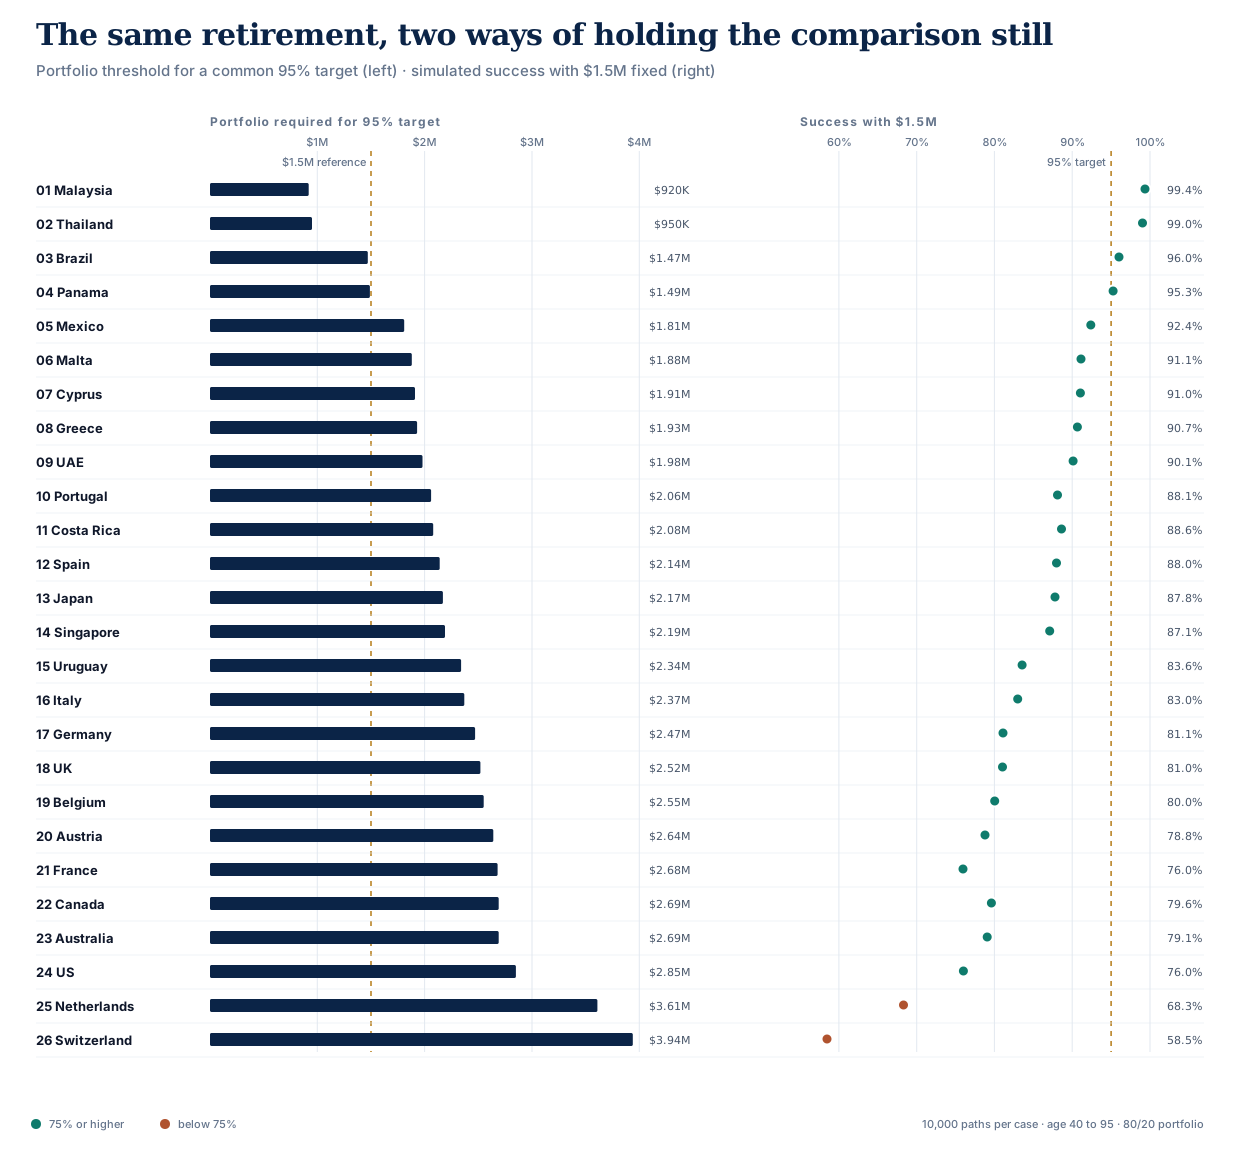
Countries stay in threshold rank order in both panels. The second panel holds the portfolio at $1.5M; it does not reuse the probability from the threshold search.
Re-run this with your own numbers
The country links in the ranking open the exact published cases. To replace the age, spending, portfolio, and country instead of inheriting one country's assumptions, start a new Retirement Lab scenario.
Each linked scenario includes the country-specific assumptions and known simplifications used in that run. Expand its country tax-policy pill to see them. The broader engine is described on the methodology page.